Do you want to start trading or improve your trading skills and increase your profitability? Understanding the best candlestick patterns in trading can be a game-changer for traders of all levels.
In this comprehensive guide, we will dive deep into the world of candlestick patterns, finding out how they work, how to recognize them, and how to use them to your advantage in trading.
What are candlestick patterns?
Candlestick patterns are visual representations of price movements over a specific time frame. They provide insight into market sentiment and can help traders make informed decisions. These patterns are formed by the opening, closing, high and low prices during a trading session.
The Power of Candlestick Patterns
Candlestick patterns have been used for centuries by traders to predict future price movements. They provide valuable information about market psychology and can be helpful in determining when to buy or sell an asset. Let’s look at some of the best candlestick patterns that can have a significant impact on your trading success.
1. Bullish Engulfing Pattern
A bullish engulfing pattern forms when a small bearish candle is followed by a larger bullish candle that completely engulfs the previous candle. This pattern indicates a possible trend reversal from bearish to bullish.
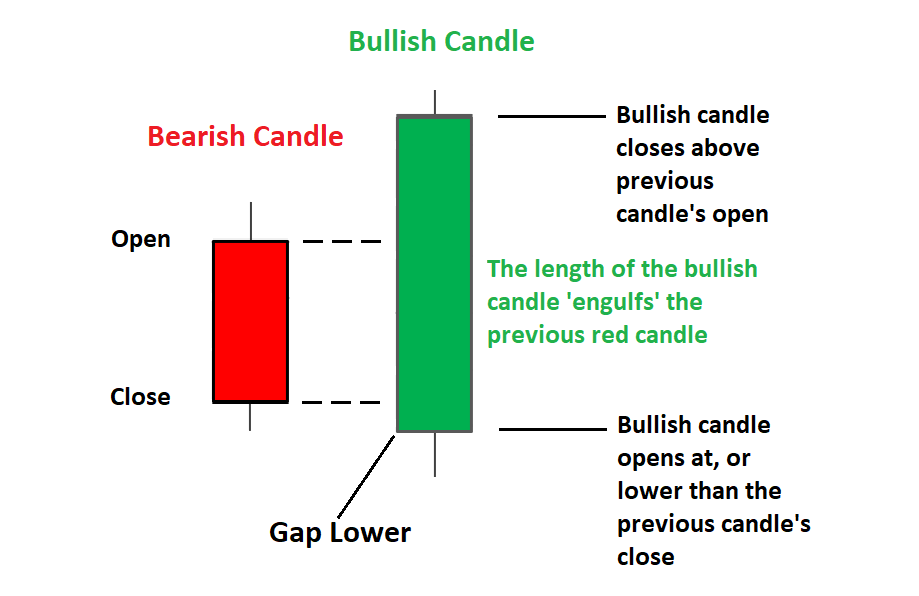
This shows that buyers have taken control, and is an excellent opportunity to consider buying.
2. Bearish Engulfing Pattern
Conversely, the Bearish Engulfing Pattern is the opposite of the Bullish Engulfing Pattern. It is formed when a small bullish candle is followed by a large bearish candle which engulfs the previous candle.
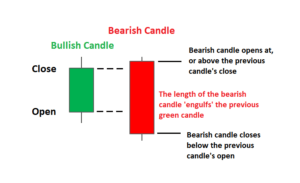
This pattern signals a change from a bullish trend to a bearish one, indicating a potential selling opportunity.
3. Hammer
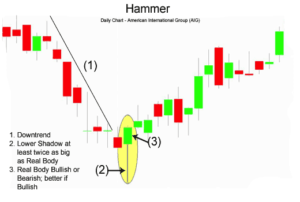
The hammer is a single candlestick pattern with a short body and a long lower shadow. It appears after a downtrend and indicates that the bears have lost control. This pattern could be a strong signal for a potential reversal and a good time to consider buying.
4. Falling Star (Shooting Star)
The Shooting Star is another single candlestick pattern but with a smaller body and a longer upper shadow.
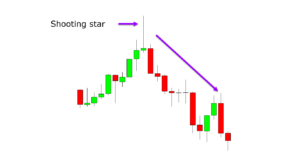
This occurs after an uptrend and indicates that the bulls are losing their grip. Traders often interpret this pattern as a signal to sell or consider a short position.
5. Doji
Doji is a small-bodied candlestick pattern, where the opening and closing prices are approximately the same.
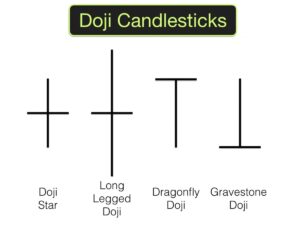
It symbolizes indecision in the market and suggests that a reversal or significant move may be imminent. Traders should keep an eye out for confirmation signals when seeing a doji.
6. Morning Star
The morning star is a three-candlestick pattern that typically appears at the end of a downtrend. It starts with a bearish candle, followed by a small bullish or bearish candle with a gap below and, finally, a strong bullish candle.
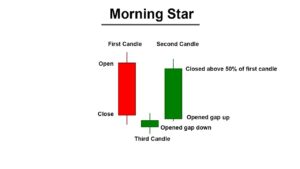
This pattern indicates a potential trend reversal from bearish to bullish and is a strong buy signal.
7. Evening Star
Conversely, the evening star is opposite the morning star. It appears at the end of an uptrend and consists of a bullish candle, a short bullish or bearish candle with a gap, and a strong bearish candle.
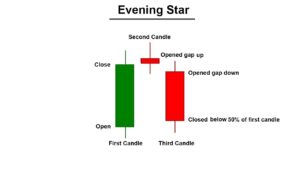
This pattern suggests a potential trend reversal from bullish to bearish, making it an ideal time to consider selling.
How to use candlestick patterns in your trading strategy
Now that you have learned about some of the best candlestick patterns, it is important to understand how to effectively incorporate them into your trading strategy.
1. Confirmation: Always wait for confirmation before trading based on candlestick patterns. Look for additional technical indicators or price action that support your decision.
2. Risk Management: Apply proper risk management techniques, such as setting stop-loss orders, to protect your capital if the trade goes against you.
3. Time Frame: Consider the time frame in which you are trading. Some candlestick patterns may work better on smaller time frames, while others are more reliable on longer time frames.
4. Combine with other strategies: Candlestick patterns work best when used in combination with other technical analysis tools and strategies. Don’t rely solely on them for your trading decisions.
Conclusion
Incorporating the best candlestick patterns into your trading strategy can significantly improve your chances of success in the financial markets. Remember to be patient and disciplined when using these patterns, and always consider the broader market context. By doing this, you can harness the power of candlestick patterns to enhance your trading journey.
Finally, candlestick patterns provide valuable insight into market sentiment and potential price movements. By mastering these patterns and integrating them into your trading strategy, you can make more informed decisions and increase your chances of trading success.
Start implementing these powerful tools into your trading arsenal and watch your profits soar.
In this blog post, we have covered the best candlestick patterns in trading and how to use them to your advantage. Candlestick patterns can be a valuable addition to your trading toolkit, providing insight into market sentiment and potential trend reversals.
By understanding and effectively applying these patterns, you can enhance your trading strategy and increase your profitability. Whether you are a beginner or an experienced trader, incorporating candlestick patterns into your analysis can lead to better trading decisions and better results.